Additional reports
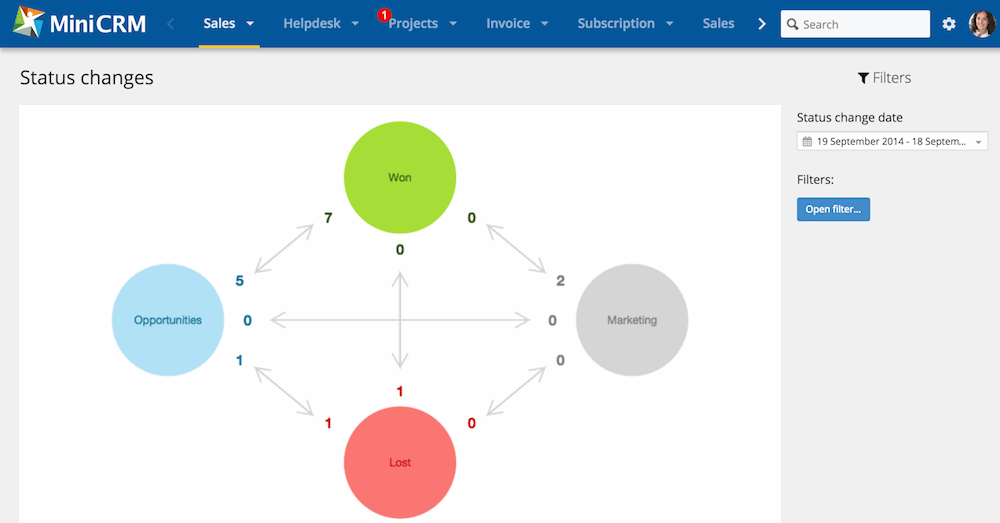
Status changes
Here you can examine the movement of cards between statuses and status groups.
Filter conditions
-
Status change date: Select a period that you would like to examine.
-
Filters: Open a filter to further narrow the number of examined cards.
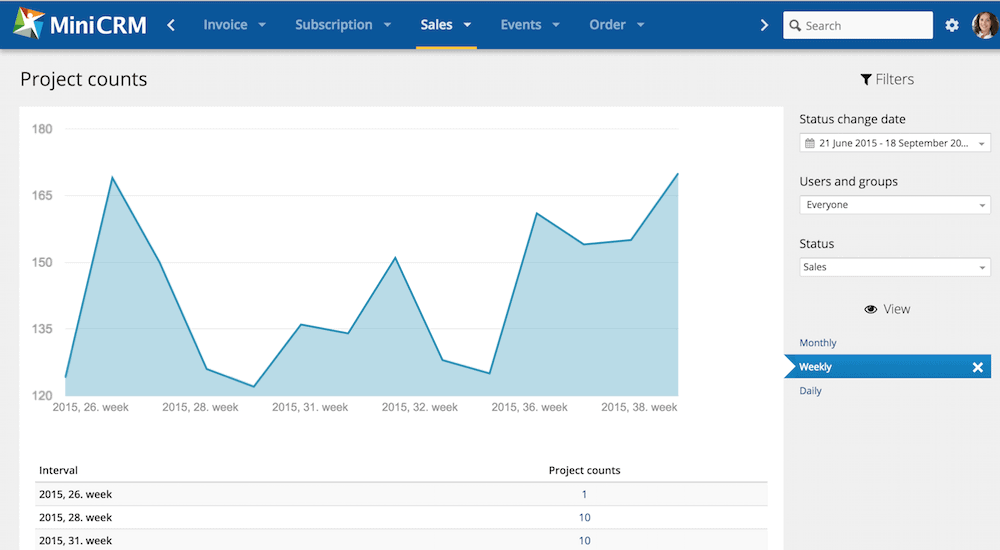
Project counts
The report shows that how many cards belong to a user, user group or to the company as a whole.
Filter conditions
-
Status change date: Those cards will be displayed on which there was a status change during the selected period.
-
Users and groups: Opportunities belonging to the selected user (owner) will be displayed. In the new Sales module it is also possible to filter by user groups.
Views
You can choose from Weekly, Monthly, and Quarterly views. The diagram will be rearranged and the cards will be grouped according to the selected option.
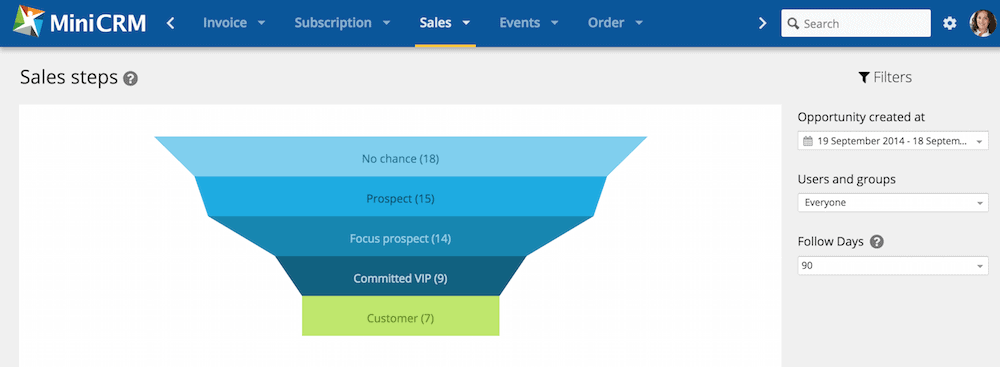
Sales steps
This report shows how many leads did you lost in the different sales statuses during the examined period. In other words, how many leads got into the next statuses, and how many of them became customers.
Filter conditions
-
Card created at: Those cards will be displayed that were created during the period set here.
-
Users and groups: Only cards belonging to the selected users or user groups (in new sales module) will be examined.
-
Follow days: Status changes are examined from the creation of opportunities to the number of days set here.
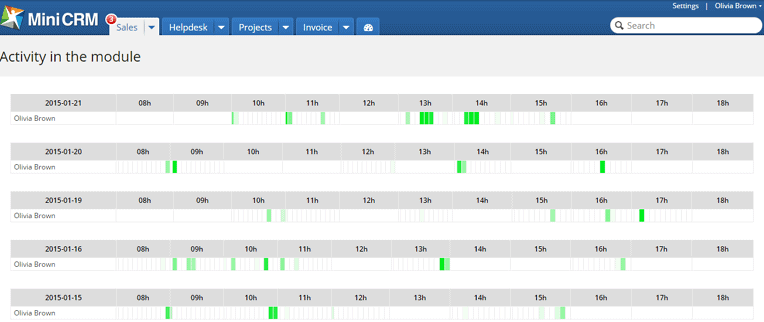
Activity in the module
This report shows when users were logged in and how effectively they have worked in the system.
Users’ activity is divided by hours.
The hours are further divided by 5 minutes. The shade of the green area depends on the level of users’ activity. The more users work in the system, the darker green the area is.
Wall of Shame
It is displayed on Today view page and examines every active user.
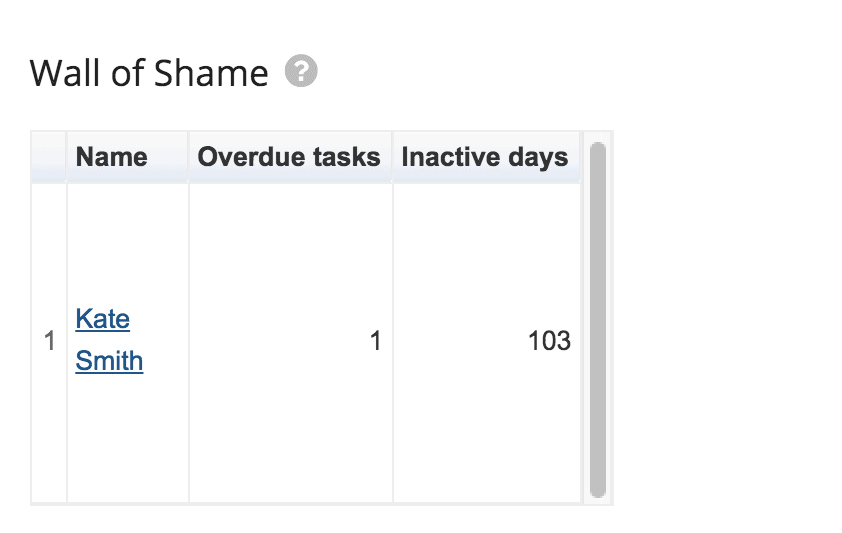
It shows the 6 most “problematic” users. The following logic applies to the list:
If the overdue tasks + inactive days are more than 15 units, the user is put on the list and the first 6 users are displayed in the table.
The report is updated continuously. To prevent yourself from being on the list, log into the system and complete your overdue tasks. To see a user’s statistics, click on their name.
All closing rates
It is displayed on Today view page and aggregates the closing rates of the different Sales modules (if you have more than one). It examines the past 30 days and the performance of every user.
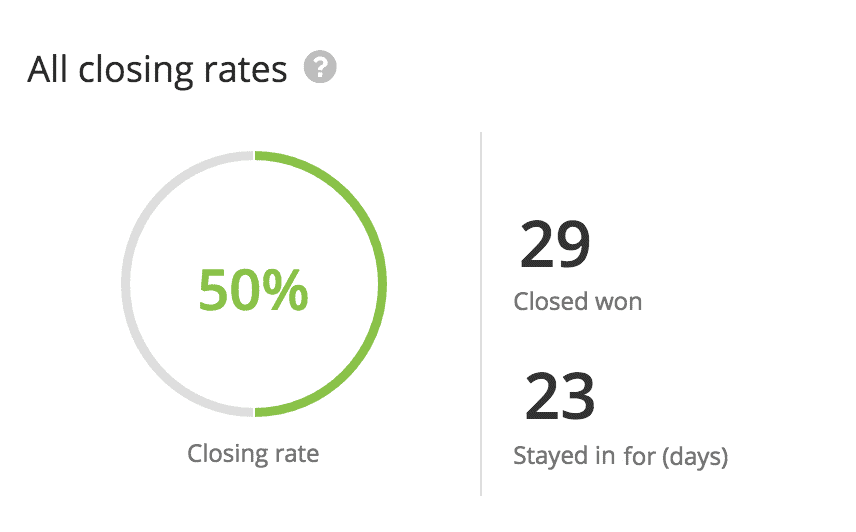
Closing rate: ‘closed lost / closed all’ leads of the past 30 days. Every user and Sales module is examined.
Closed won (pc): ‘closed won’ leads of the past 30 days. Every user and Sales module is examined.
Stayed in for (days): Average of days that were necessary to close a sales. Every user and Sales module is examined.